Tumor Mutational Burden: From Research to Clinical Reality
Every few years, a biomarker arrives that genuinely changes how we think about treatment selection. TMB was one of them. It gave us a number, a threshold, and a new way to ask which patients might respond to immunotherapy. But as with most things in oncology, the closer you look, the more complex the picture becomes. Here is what the evidence actually says.
Key takeaways
- TMB has genuine predictive value for ICI response in select tumor types, but the FDA pan-cancer approval does not mean universal clinical validity across all solid tumors.
- Platform variability and the absence of a biologically derived universal threshold mean that the same tumor can be classified differently at different institutions, with real consequences for treatment access.
- TMB counts mutations. It does not measure neoantigen quality, microenvironment, or antigen presentation capacity. Refined metrics like clonal TMB and composite multi-biomarker panels are the direction the field is moving.
- The path forward requires prospective validation, tumor-type-specific thresholds, and cross-platform standardisation. Using TMB thoughtfully and within its evidence base is both clinically responsible and scientifically honest.
A biomarker born from a big idea
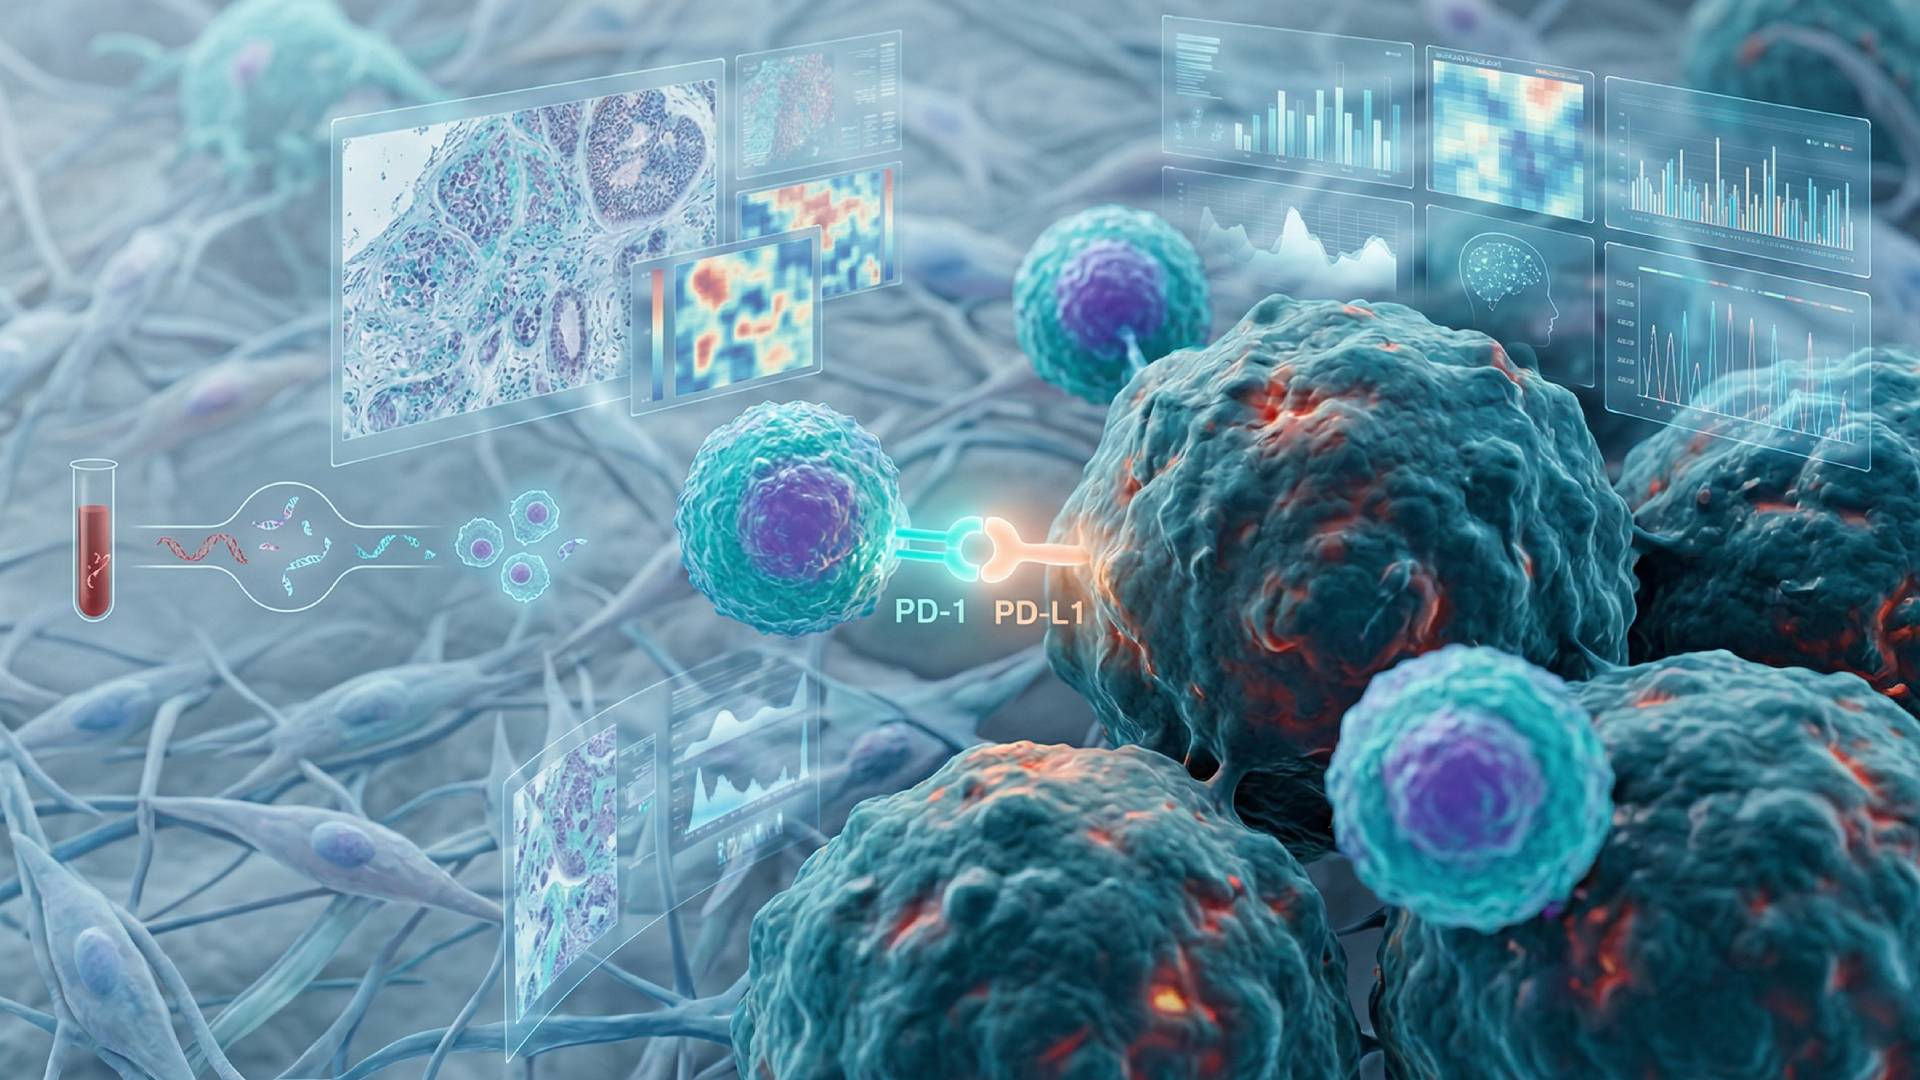
The immune system can, under the right conditions, recognise and destroy cancer cells. Immune checkpoint inhibitors (ICIs) unlock this response by blocking inhibitory signals. But ICIs do not work for everyone. Most patients, even those who appear to be good candidates, do not respond. That gap between expectation and outcome is what drove the search for better predictive biomarkers.
Tumor mutational burden, or TMB, emerged from a straightforward biological rationale. When a tumor accumulates somatic mutations, some of those mutations generate altered peptides, called neoantigens, that can be displayed on the tumor cell surface. T cells can recognise these neoantigens as foreign. The more mutations a tumor carries, the higher the probability that at least some of those mutations will produce immunogenic neoantigens. Higher neoantigen load should, in theory, translate to better immune recognition and, therefore, better response to ICIs.
TMB is defined as the total number of somatic non-synonymous mutations per megabase of sequenced genomic region. It can be measured from tumor tissue using whole exome sequencing (WES), from targeted gene panels, or from circulating tumor DNA in blood. Each approach comes with its own trade-offs.
From lab finding to FDA approval
The case for TMB built gradually. Early studies in melanoma and non-small cell lung cancer (NSCLC) showed that patients with higher mutation burdens responded better to ICI therapy. These tumor types have naturally high TMB due to the mutagenic effects of ultraviolet radiation and tobacco smoke respectively, and they were also the cancers showing the most dramatic clinical responses to checkpoint blockade.
The pivotal moment came with the KEYNOTE-158 trial. This multicohort phase II study treated patients with previously treated, unresectable, or metastatic solid tumors with pembrolizumab. Patients with TMB of 10 or more mutations per megabase, classified as TMB-high, achieved an objective response rate of 29%, compared to 6% in TMB-low patients.
In June 2020, the FDA approved pembrolizumab for any unresectable or metastatic solid tumor with TMB-high status, defined as a score of 10 mutations per megabase or higher as measured by the FoundationOne CDx assay. It was the first tumor-agnostic approval based on a mutational biomarker.
Where the evidence holds and where it does not
The clinical picture of TMB is more nuanced than the approval suggests. In some tumor types, TMB-high reliably identifies patients who benefit from immunotherapy. In others, the relationship breaks down entirely.
| Cancer type | TMB-high predictive value | Key finding |
| NSCLC | Moderate, context-dependent | Strongest in non-driver-mutation tumors; EGFR/ALK-mutated NSCLC responds poorly despite high TMB |
| Melanoma | Moderate to strong | UV-induced high TMB associated with durable ICI responses |
| Renal cell carcinoma | Weak | Responds well to ICI despite low TMB; other immune mechanisms dominate |
| Glioma | Negative association | TMB-high patients treated with ICI showed worse overall survival than those on other therapies |
| Breast cancer | Weak to absent | High TMB does not consistently predict ICI benefit; excluded from approving trial |
| Prostate cancer | Weak to absent | No reliable predictive signal across most subtypes; also excluded from approving trial |
| Colorectal cancer (MSS) | Absent | TMB-high benefit not seen in microsatellite-stable/mismatch-repair proficient CRC |
The glioma finding deserves particular attention. Not only does TMB-high fail to predict benefit in glioma patients, there is evidence of harm. Patients with TMB-high glioma treated with ICI therapy had worse outcomes than those receiving other modalities. This is a signal that warrants serious caution.
Renal cell carcinoma tells a different story. It responds remarkably well to ICI therapy despite having relatively low TMB. Merkel cell carcinoma is similar. These examples remind us that TMB is one dimension of tumor immunogenicity, not the whole picture.
The measurement problem is real
Even setting aside the biology, there is a substantial technical challenge in how TMB is measured. And it matters enormously for clinical decisions.
1. Platform and pipeline variability
WES remains the gold standard for TMB measurement because it interrogates the full coding genome. In clinical practice, targeted gene panels are used because they are faster and cheaper. But panels vary in the number of genes included, the genomic regions covered, the sequencing depth, and the bioinformatics pipeline used to call variants. Two panels assessing the same tumor can produce meaningfully different TMB scores.
A patient tested at one institution may receive a TMB-high classification. The same patient’s tumor tested at another institution may fall below the threshold. The tumor has not changed. The underlying biology has not changed. The number has changed because the measurement tool changed.
2. The cutoff problem
The 10 mutations per megabase threshold that anchors the FDA approval was derived from the FoundationOne CDx assay. It was not established through systematic, cross-platform biological validation. It reflects a regulatory decision made with a specific assay, in a specific trial, for a specific drug.
The biological difference between 9.8 and 10.2 mutations per megabase is essentially zero. Yet this threshold carries substantial clinical weight. Patients on one side may be offered pembrolizumab. Patients on the other side may not, and payer decisions often follow the same line. That is a discomfort that sits with many oncologists.
The standardisation gap: In 2024, the Association for Molecular Pathology, the College of American Pathologists, and the Society for Immunotherapy of Cancer published joint consensus recommendations on TMB assay validation and reporting. Their statement acknowledged directly that the variety of approaches for calculating and reporting TMB, along with few comprehensive methodological descriptions, pose significant challenges to clinical adoption.
3. Tumor purity and germline filtering
Low tumor cellularity in a sample can suppress measured TMB, causing an underestimate. Conversely, failure to filter germline variants can inflate scores, particularly in patients with hereditary cancer syndromes. These are not edge cases. They are sources of systematic error that affect clinical classification in routine practice.
The biomarker is not the biology
Here is the most important scientific tension in the TMB field. TMB counts mutations. It does not measure neoantigen quality. It does not capture T cell receptor repertoire diversity. It does not describe the tumor microenvironment. It tells you nothing about HLA haplotype, which determines whether a given peptide can actually be presented to T cells. All of these factors mediate the relationship between mutation count and immune response.
Subclonal mutations, present in only a fraction of tumor cells, are far less likely to generate consistent immune responses than clonal mutations present in all cells. A tumor with 20 mutations per megabase, all subclonal, may be immunologically quieter than one with 12 clonal mutations in essential genes. Total TMB as currently measured does not distinguish between these two patients.
This is why researchers are actively investigating refined versions of the metric. Clonal TMB, which counts only mutations present in the majority of tumor cells, shows more consistent associations with ICI response in early data. HLA-corrected TMB, which adjusts for the patient’s antigen presentation capacity, is another direction. Persistent TMB, tracking mutational profiles across time with serial biopsies or liquid biopsy, adds a dynamic dimension.
The field is moving, but clinical practice is still built on the cruder measure.
Combining biomarkers is necessary, not optional
No single biomarker has proven sufficient for immunotherapy patient selection, and TMB is no exception. The research increasingly points toward composite approaches.
PD-L1 expression and TMB capture different dimensions of tumor immunogenicity. They are not significantly correlated within most cancer subtypes. A tumor can be TMB-high with low PD-L1 expression, or TMB-low with high PD-L1 expression. Counterintuitively, KEYNOTE-158 showed no correlation between PD-L1 expression and TMB level, which is why the FDA approval was not restricted to PD-L1-positive tumors.
Patients with both high TMB and high T-cell-inflamed gene expression profiles, or high TMB and high CD8+ T cell density, show substantially higher response rates than those with high TMB alone. Adding microsatellite instability status, tumor aneuploidy, and markers of the tumor microenvironment further refines prediction.
The practical challenge is that combining biomarkers increases complexity, cost, and the interpretive burden on clinicians. When biomarkers are discordant, the guidance available is limited. A PD-L1-negative, MSI-high tumor is relatively straightforward: MSI-H takes priority. But a TMB-high, EGFR-mutated NSCLC patient? The answer requires clinical judgement that no single number can provide.
Liquid biopsy and what it could change
Blood-based TMB, derived from circulating tumor DNA, carries real practical advantages. Tissue biopsies are invasive, sometimes unavailable, and represent only one spatial snapshot of a heterogeneous tumor. Blood draws can be repeated over time, offering the possibility of tracking mutational profiles as the disease evolves and as treatment alters the tumor.
The correlation between blood-based TMB and tissue TMB is moderate. A recent study in NSCLC patients reported a Spearman correlation of approximately 0.50. When using median values to classify patients as TMB-high or TMB-low, around 75% of patients were classified the same way by both approaches. That means one in four patients would be classified differently depending on whether blood or tissue was used.
The optimal threshold for blood TMB is also different from the tissue threshold. Values of around 16 mutations per megabase in blood have been shown to correspond roughly to 13 mutations per megabase in tissue. Treating tissue-derived cutoffs as directly applicable to blood-based measurements is not supported by current data.
Despite these limitations, blood-based TMB is a genuinely promising direction, particularly for real-time treatment monitoring and detecting early resistance mechanisms. The field is not there yet, but the trajectory is clear.
What the large-scale data tells us
A 2025 analysis examined real-world overall survival in more than 8,000 patients treated with single-agent ICI across 24 cancer types, using the FDA-approved FoundationOne CDx assay. Across this cohort, TMB-high status was associated with more favourable survival compared to similar patients with lower TMB levels. The association held within individual cancer types where sample sizes were sufficient for analysis.
This is the most comprehensive real-world validation of the TMB-OS relationship to date, and it supports the biomarker’s continued use. But even this analysis reinforces the importance of cancer-type-specific interpretation. The overall signal does not mean the signal is equal, or even present, in every tumor type.
Where the field is going
The TMB field is advancing along several parallel tracks:
- Refinement of the metric itself, moving from total to clonal, persistent, and HLA-corrected TMB
- Improved laboratory standardisation through frameworks like the Friends of Cancer Research TMB harmonisation initiative and the 2024 AMP consensus guidelines
- Integration with multi-omic biomarker panels incorporating the tumor microenvironment, epigenetic signatures, and circulating markers
- Blood-based TMB development for serial monitoring, with ongoing work to establish reliable clinical thresholds
- Prospective, randomised trials using TMB as a prespecified primary stratification biomarker, not a post-hoc exploratory analysis
The 10 mutations per megabase threshold will almost certainly not be the final word. The question is whether the field can move toward more biologically grounded, tumor-type specific thresholds before clinical adoption outruns the evidence.
Stay ahead of the biomarker conversation with Immunomark
The science around TMB is still evolving. New data on clonal TMB, blood-based assays, and multi-biomarker integration is emerging fast. If you work in oncology research or clinical practice and want to be first to access tools, resources, and insights built around the latest in precision oncology biomarkers, ImmunoMark is worth your attention.
Register your interest today and be among the first to know when we launch. Register Interest →
#Biomarkers
#CancerResearch
#ClinicalTrials
#IOConferences